Your experiment has: 1) three or more independent groups (e.g., independent animals given a drug at one of three different doses) and continuous data is collected at one time point (e.g., reaction time to salient stimulus) OR 2) continuous data from one group of subjects, collected at three or more different time points (e.g., baseline, drug-dose 1, drug-dose 2, etc.) OR 3) continuous data with more than one categorical predictor, each made up from independent groups (e.g., wild-type and mutant subjects scored for responses to novel stimuli following either individual or group housing) 4) continuous data from one group of subjects, with each subject exposed to more than one type of treatment or time point (e.g., the effects on locomotor activity of two doses of a drug in two separate environments) 5) continuous data from a mixture of independent groups and repeated measurements (e.g., wild-type vs mutant scored at baseline, drug-dose 1, drug-dose 2, etc.). You may also be adding a continuous covariate (e.g., wild-type vs. mutant scored at baseline, drug-dose 1, drug-dose 2, etc., controlling for weight).
Three or more independent groups (between-subjects design)
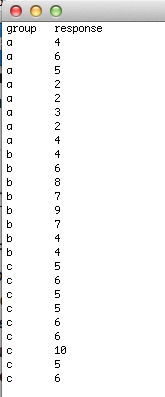
First, write the information about your groups in column 1. You can do this initially in Excel, or whatever spreadsheet programme you use, and once the data is entered, simply save the file as ".txt". Here, I have called the groups 'a' 'b' and 'c', but you can call them whatever you like (e.g., 'wt', 'het' and 'hom' for wild-type and heterozygous and homozygous mutants). Word of warning to R newbies: R is case sensitive (i.e., hi ≠ Hi ≠ hI ≠ HI) and does not like gaps. I would suggest using all lower-case letters for variable names. If you need a gap for some reason, use underscore (a_b). Also, if you enter your groups as simply '1', '2', '3', etc., R will treat the variable 'group' as an integer value. This is easy to rectify in R once you start working with the datasheet, but if you can avoid numbers alone as nominal variables, this will make life a little easier.
First, write the information about your groups in column 1. You can do this initially in Excel, or whatever spreadsheet programme you use, and once the data is entered, simply save the file as ".txt". Here, I have called the groups 'a' 'b' and 'c', but you can call them whatever you like (e.g., 'wt', 'het' and 'hom' for wild-type and heterozygous and homozygous mutants). Word of warning to R newbies: R is case sensitive (i.e., hi ≠ Hi ≠ hI ≠ HI) and does not like gaps. I would suggest using all lower-case letters for variable names. If you need a gap for some reason, use underscore (a_b). Also, if you enter your groups as simply '1', '2', '3', etc., R will treat the variable 'group' as an integer value. This is easy to rectify in R once you start working with the datasheet, but if you can avoid numbers alone as nominal variables, this will make life a little easier.
One group, three or more different treatments/time points (within-subjects design)
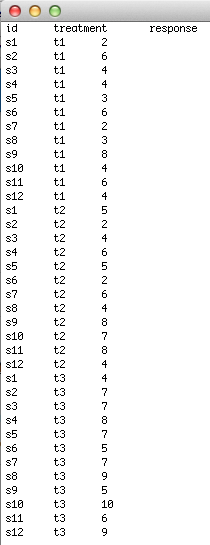
The data entry for this type of data is similar to that above. This time, however, in the first column enter the subject ID (this is necessary for the analysis), time (or treatment) in the second column and the response in the third column.
The data entry for this type of data is similar to that above. This time, however, in the first column enter the subject ID (this is necessary for the analysis), time (or treatment) in the second column and the response in the third column.
More than one categorical predictor (between subjects design)
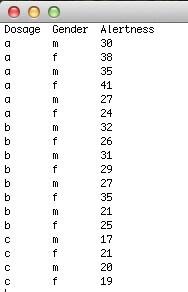
Again, this is similar to the first example, but this time but your first predictor in column 1 and your second in column 2, and so on. Your response will go in the final column. In this example, we are seeing if a drug has a dose dependent effect on alertness in both male and female subjects. Each subject receives only one of the three doses, and each row represents a different subject.
Again, this is similar to the first example, but this time but your first predictor in column 1 and your second in column 2, and so on. Your response will go in the final column. In this example, we are seeing if a drug has a dose dependent effect on alertness in both male and female subjects. Each subject receives only one of the three doses, and each row represents a different subject.
Two or more time-point or treatment variables (within-subjects design)
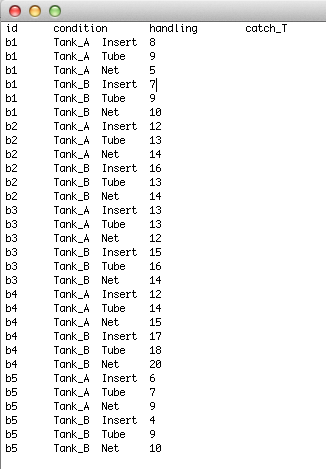
Here, the first column will be the subject ID variable, the second will be the first time/ treatment variable, the third with be the second time/treatment variable, and so on. The final column will be your response variable. In this example, we are interested in the amount of time it takes to catch a fish in one tank or another, depending on the type of catching device. 'condition' is the first treatment (Tank A or Tank B) and 'handling' is the second treatment (insert, tube, net). 'catch_T' is the response. All subjects are tested in each condition.
Here, the first column will be the subject ID variable, the second will be the first time/ treatment variable, the third with be the second time/treatment variable, and so on. The final column will be your response variable. In this example, we are interested in the amount of time it takes to catch a fish in one tank or another, depending on the type of catching device. 'condition' is the first treatment (Tank A or Tank B) and 'handling' is the second treatment (insert, tube, net). 'catch_T' is the response. All subjects are tested in each condition.
A mixture of independent groups and repeated measures (mixed design)
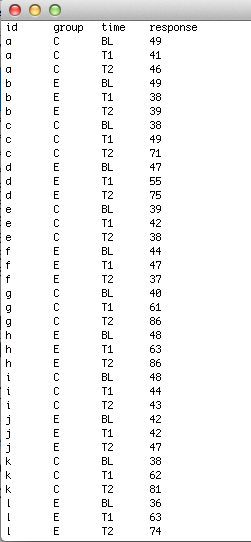
Here, your data will be several observations on members of different groups. As you have repeated measures on the same subjects, you will need subject ID in the first column, your group allocation in the second column, the repeated measure (e.g., treatment condition or time point, etc.) in the third column, and the response in the fourth. In this example, we have subjects in one of two groups (C and E) at three different time points (BL, T1 and T2).
Here, your data will be several observations on members of different groups. As you have repeated measures on the same subjects, you will need subject ID in the first column, your group allocation in the second column, the repeated measure (e.g., treatment condition or time point, etc.) in the third column, and the response in the fourth. In this example, we have subjects in one of two groups (C and E) at three different time points (BL, T1 and T2).