ANOVA and non-parametric equivalent
So, your experiment has either: 1) three or more independent groups (e.g., independent animals given a drug at one of three different doses) and continuous data is collected at one time point (e.g., reaction time to salient stimulus) OR 2) continuous data from one group of subjects, collected at three or more different time points (e.g., baseline, drug-dose 1, drug-dose 2, etc.) OR 3) a continuous data from a mixture of independent groups and repeated measurements (e.g., wild-type vs mutant scored at baseline, drug-dose 1, drug-dose 2, etc.). You may also be adding a continuous covariate (e.g., wild-type vs. mutant scored at baseline, drug-dose 1, drug-dose 2, etc., controlling for weight).
The first thing is to enter your data and import the data into R ready for analysis. Then, you need to check the sample for homoscedascticity (similar variances are needed for each group). ANOVAs are fairly robust against small amounts of heteroscedasticity, but it is an idea to check to make sure there are not major violations. For repeated measures tests (1 or more groups tested at 2 or more time points) one thing that does matter is sphericity, which is the equivalent of this but in terms of pairs (related samples).
The first thing is to enter your data and import the data into R ready for analysis. Then, you need to check the sample for homoscedascticity (similar variances are needed for each group). ANOVAs are fairly robust against small amounts of heteroscedasticity, but it is an idea to check to make sure there are not major violations. For repeated measures tests (1 or more groups tested at 2 or more time points) one thing that does matter is sphericity, which is the equivalent of this but in terms of pairs (related samples).
Tests for equal variances (homoscedasticity and sphericity)
For independent groups (e.g., three or more independent groups (e.g., independent animals given a drug at one of three different doses) and continuous data is collected at one time point (e.g., reaction time to salient stimulus)) you can check the equality of variances by carrying out a Levene's test. The first time you do this, you will need to install a package called lawstat:

and make it active:

Once you have activated your datasheet in R, you can carry out the test straight-forwardly:
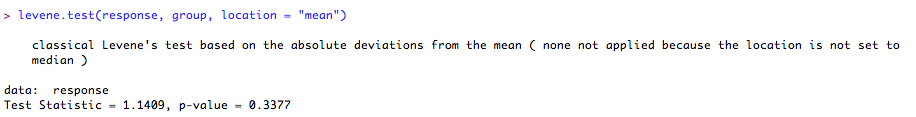
This tests the null-hypothesis that the variances are the same. In other words, if the 'p' value is < 0.05, you may have a problem with equality of variances. In order to deal with this, you could try log-transforming the response variable, or alternatively use a non-parametric test instead (see below). If you wish to transform the response variable, in R this is very straight-forward:

You can then re-run the levene's test (as above) but change the 'response' variable to your new transformed 'ln_resp' variable name. If this removes the heteroscedasticity, you will be fine using this for the analysis. As I said, though, unless the 'p' value is very low (~0.01) for violations of homoscedasticity, I would not be too concerned, as ANOVA is very robust against this. The only case where you need to be especially careful is if the groups are different sizes. In this instance, there could be a problem with the robustness of ANOVA, so I would advise using non-parametric equivalent.
If you are using a repeated measures design, i.e., continuous data from one group of subjects, collected at three or more different time points (e.g., baseline, drug-dose 1, drug-dose 2, etc.) or continuous data from a mixture of independent groups and repeated measurements (e.g., wild-type vs mutant scored at baseline, drug-dose 1, drug-dose 2, etc.), you will need to test for sphericity. This is really important
With ANOVA, as it is a type of general linear model, we will carry out the rest of the diagnostics (normality of errors) after we have fit the model.
Run the ANOVA
1. One-way ANOVA (normal distribution assumed)
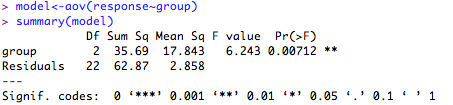
Check the fit of the model:
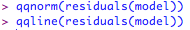
This produces something like:
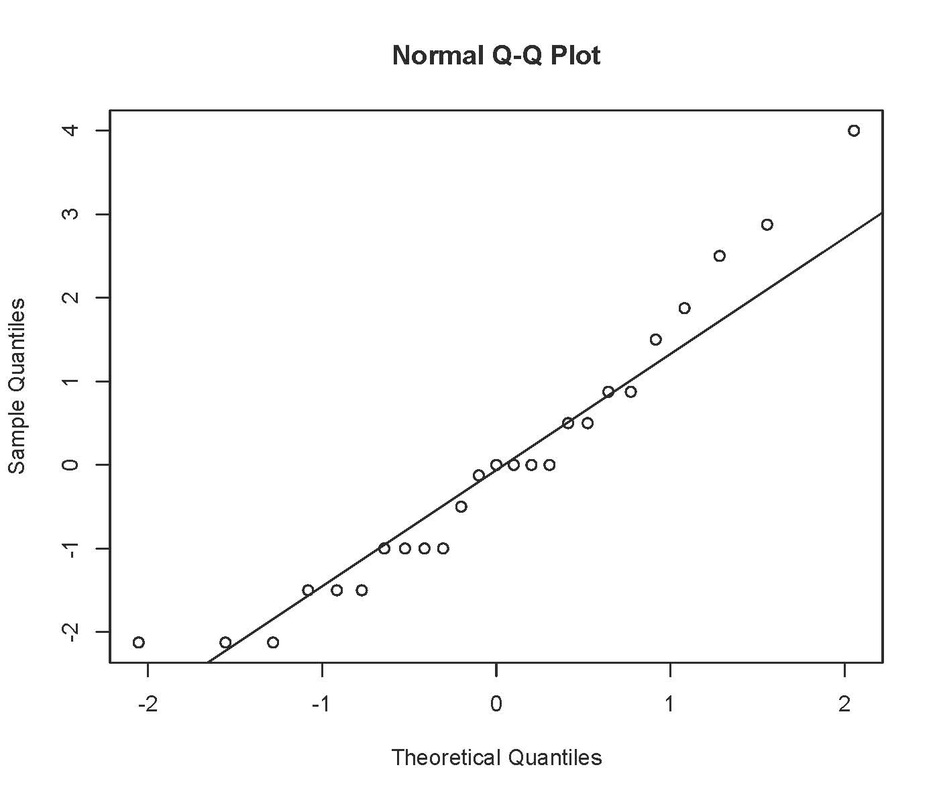
Not perfect, as the errors should fall in an approximately straight line. ANOVA is fairly robust against small deviations from normality, especially if you have a decent sample size, but you could try a log transformation on these data to see if that improves the fit:
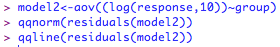
Is that any better? I would say probably not, and would stick with the untransformed data in this case.
