Your experiment will have continuous predictor variables and a variety of different types of response variable. These response variables could be continuous (e.g., weight), count data (e.g., number of pups in a litter) or binary (e.g., win/lose trials or mortality at time point x). So, choose this test if you have any of the following: 1) one group of subjects with two continuous variables (e.g., subject's weight and subject's height), OR 2) two groups of subjects, each with one continuous variable (e.g., maternal alcohol consumption during pregnancy (units/day) and birth weight of offspring), OR 3) one or more groups of subjects with a continuous predictor (e.g., years smoking) and a binary outcome (e.g., mortality at age 70) OR 4) one or more groups of subjects with a continuous predictor (weight in gestation) and a 'count' outcome (e.g., number of pups in litter). Finally, you may also have 'random effects' in this design. Random effects are special cases of grouping variables where the 'group' you are measuring may have been drawn from a larger population at random. For example, if you use laboratory animals for your work, and your subjects are housed in groups of three or four (maybe 2 treatment and 2 control in one cage), 'cage' could act as a random effect. This means that in your statistical model, any variability that was caused by cage would be accounted for in the model. Repeated measures ANOVAs are a special case of random effects model, as 'subject' (or what ever your repeated measures are on) is treated as a random effect.
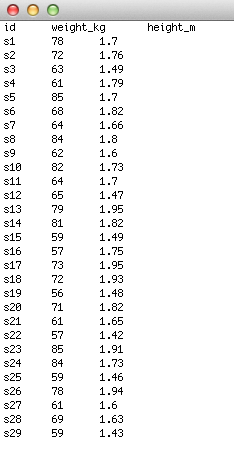
One group, 2 continuous variables
In this case, if you are comparing one group on two different measures (e.g., weight and height, as in the example), the first column should be your subject ID (this is not necessary, but useful for keeping track of who-is-who), then the second and third, and so on, should be the continuous variables of interest. If you have any other variables (for example, covariates that you wish to put into your correlation to test for potentially confounding effects) these can also be added in subsequent columns.
In this case, if you are comparing one group on two different measures (e.g., weight and height, as in the example), the first column should be your subject ID (this is not necessary, but useful for keeping track of who-is-who), then the second and third, and so on, should be the continuous variables of interest. If you have any other variables (for example, covariates that you wish to put into your correlation to test for potentially confounding effects) these can also be added in subsequent columns.
Two groups of subjects, each with one continuous response
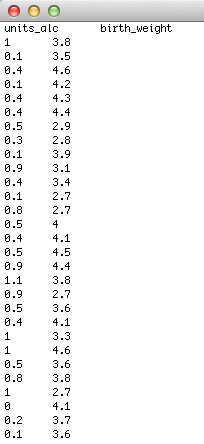
Here, you will have two groups of subjects that are being measured on two theoretically related continuous variables (e.g., maternal alcohol consumption and birth-weight of offspring).
Here, you will have two groups of subjects that are being measured on two theoretically related continuous variables (e.g., maternal alcohol consumption and birth-weight of offspring).
One or more groups of subjects with a continuous predictor and a binary response (e.g., yes/no; present/absent)
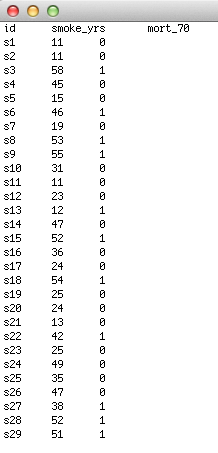
Here, your data will consist of one (or possibly more, but let's concentrate on one for now!!) continuous predictor, and an outcome variable that is binary. An example of this might be number of years that a subject has been smoking, and the outcome might be their mortality at age 70. In other words, column 1 will be "subject ID" (not absolutely necessary, but it helps to keep track), column 2 will be "years smoking" and column 3 will be "mortality at age 70" (i.e., "1" for alive, "0" for dead).
Here, your data will consist of one (or possibly more, but let's concentrate on one for now!!) continuous predictor, and an outcome variable that is binary. An example of this might be number of years that a subject has been smoking, and the outcome might be their mortality at age 70. In other words, column 1 will be "subject ID" (not absolutely necessary, but it helps to keep track), column 2 will be "years smoking" and column 3 will be "mortality at age 70" (i.e., "1" for alive, "0" for dead).
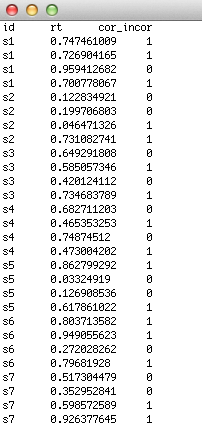
One or more groups of subjects with a continuous predictor and a series of binary responses (e.g., yes/nos; present/absents)
This format is similar to that above, but corresponds to data where there is more than one binary outcome for each subject. This is called 'binomial' data. An example of this might be an experiment where the subject has to respond continuously to stimuli and you are interested in "reaction time" and "right/wrong". Of course, it is possible simply to take a proportion of correct answers, but then you lose possibly valuable data about individual trials. This way of entering the data will afford you greater spatial resoultion of your variables. So, in column 1, enter the "subject ID" (this is important here as there will be > 1 measurment for each subject), in column 2 enter the trial number (or whatever your repeated measure is), in column 3 enter the reaction time (your continuous variable) and finally in column 4, enter your binary outcome for each trial (i.e., right/wrong).
This format is similar to that above, but corresponds to data where there is more than one binary outcome for each subject. This is called 'binomial' data. An example of this might be an experiment where the subject has to respond continuously to stimuli and you are interested in "reaction time" and "right/wrong". Of course, it is possible simply to take a proportion of correct answers, but then you lose possibly valuable data about individual trials. This way of entering the data will afford you greater spatial resoultion of your variables. So, in column 1, enter the "subject ID" (this is important here as there will be > 1 measurment for each subject), in column 2 enter the trial number (or whatever your repeated measure is), in column 3 enter the reaction time (your continuous variable) and finally in column 4, enter your binary outcome for each trial (i.e., right/wrong).
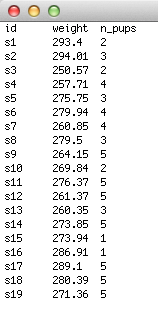
One (or more) continuous predictor(s) with an outcome that consists of counts
Here, you have data similar to other types of regression where you have measured one continuous predictor variable, but in this case the response variable is based on counts. These types of data are often fitted to a "poisson" regression, as the errors typically conform to a poisson distribution. For example, you may be interested in whether pregestational maternal weight has an impact on the number of pups in a litter. You would therefore enter "subject ID" in the first column (this is not essential, but will help you keep track of which subject is which!), column 2 is the contiunous predictor (e.g., pregestational weight) and column 3 is the number of pups in the litter (i.e., your count variable). This type of data can often produce a large number of '0' values. In this case (known as over-dispersion), poisson regressions can be particularly useful.
Here, you have data similar to other types of regression where you have measured one continuous predictor variable, but in this case the response variable is based on counts. These types of data are often fitted to a "poisson" regression, as the errors typically conform to a poisson distribution. For example, you may be interested in whether pregestational maternal weight has an impact on the number of pups in a litter. You would therefore enter "subject ID" in the first column (this is not essential, but will help you keep track of which subject is which!), column 2 is the contiunous predictor (e.g., pregestational weight) and column 3 is the number of pups in the litter (i.e., your count variable). This type of data can often produce a large number of '0' values. In this case (known as over-dispersion), poisson regressions can be particularly useful.