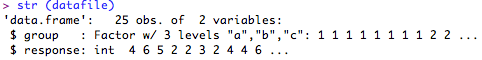
Once you have imported your datafile into R, there are various ways of exploring the file. The first few commands you will typically use quite a lot and these are basic summaries of the data file you are using. The first is the 'str' command. This tells you about the different variable in the dataset and what they represent (e.g., factors, numbers, etc.). For example, here, I have two variables: one (group) has 3 levels (a,b,c) and is a Factor. This means that it is a categorical variable. The second variable, 'response' is an integer 'int' which means that it consists of integers only. If there were decimals in the numbers it would say 'num'.
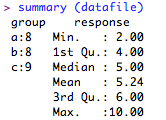
Another way is by asking for a summary of the data; this gives you slightly more information. Notice that for the variable 'group' which is categorical, R knows this and give you the N for each level of 'group'.
There are various packages in R that are helpful for descriptive statistics. My personal favourite is 'psych' (click for link to more info). This is designed for psychologists, but has loads of really cool functions that will help with many aspects of graphing and data analysis for in vivo scientists from all disciplines.
The first time you use the package (as is the case with all R packages), you need to install it by typing this into R (you will need to be online to do this):
The first time you use the package (as is the case with all R packages), you need to install it by typing this into R (you will need to be online to do this):

Whenever you want to use this package (including straight after you download it!), you will need to activate it by typing:

This package (psych) gives you more range for your descriptive statistics, including basic graphical functions (see below). For example the 'describe' function tells you about the data in more detail:

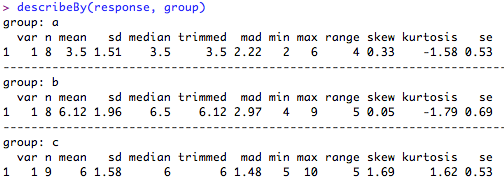
Or you can separate the description by another factor by using the 'describeBy' (note the capital letter in '..By' - you need to use this):
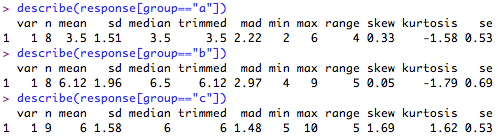
or by specific levels of this factor, by telling R which level of 'group' you are interested in with the [group == "x"] function:
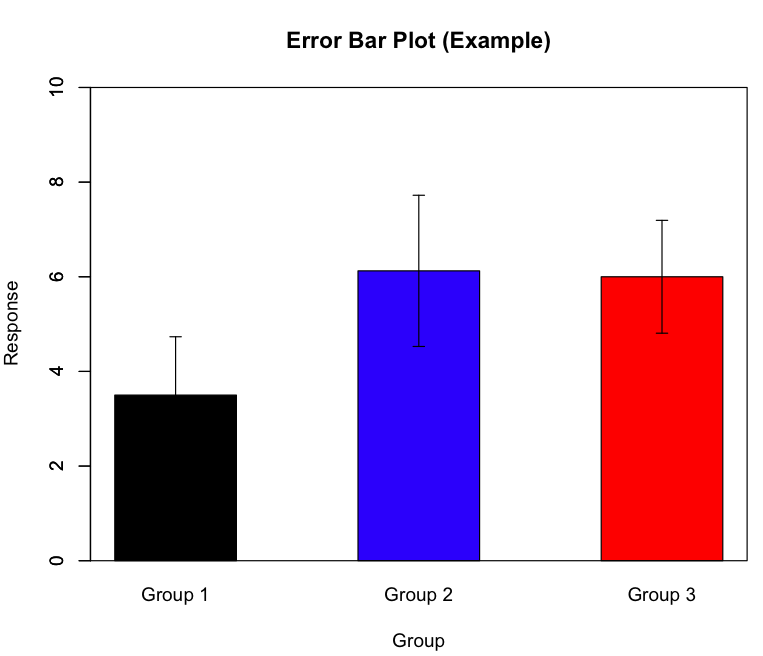
Or even draw a nice bar chart with error bars. In the code below, 'response' and 'group' are the variables in my dataset, 'xlab' and 'ylab' are the labels for the x and y axes (note that as the are words, they need to be in inverted commas), 'main' is the main title (again in inverted commas), "ylim" is the y axis range (if you leave this out R will work with your data, but this often means not starting the y axis at 0, which is clearly not always appropriate!), and the final command 'bars' should be written as 'TRUE' if you want a bar chart. If it is left blank, it will just give error bars.