Your experiment will be comparing observed frequencies of a nominal variable with expected frequencies. An example of this may be studying Mendelian inheritance. For example, suppose that a cross between two fruit flies gives you 88 offspring, 64 with black eyes and 24 with red eyes and you are trying to ascertain the genotypes of the parents. Your hypothesis is that the allele for black is dominant and that the parent flies were both heterozygous for this trait. If your hypothesis is true, then the predicted ratio of offspring from this cross would be 3:1 (based on Mendel's laws).
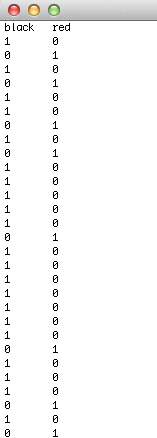
There are a few ways that the data can be entered, and this depends very much on how it is organised and collected. Below are a couple of examples. In the first, there are two columns ('black' and 'red') and a '1' and '0' value representing 'present' or 'absent'.
There are a few ways that the data can be entered, and this depends very much on how it is organised and collected. Below are a couple of examples. In the first, there are two columns ('black' and 'red') and a '1' and '0' value representing 'present' or 'absent'.
You may of course already know the observed frequencies of your data, and these can either be entered directly into R very straightforwardly. This is often easier for datasets with more observations. For example, suppose you have information about survival rates at age 70 for men and women diagnosed with a particular type of cancer at age 50. The table below outlines the frequencies that you have collected.
| Alive_70 |
Dead_70 |
|
| Male |
8769 |
263 |
| Female |
9485 |
398 |
The easiest way to enter this data is directly into R.

